Toronto, often dubbed as the financial capital of Canada, has seen its real estate market evolve dramatically over the years. The city’s skyline, dotted with skyscrapers, is a testament to its booming real estate sector. But how did we get here? Let’s walk down memory lane and explore the historical statistics of Toronto’s real estate market.
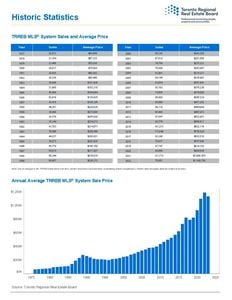
Historic Sales and Average Price Data
- 1977-1999: The late 70s and 80s saw a steady increase in the average price of homes, peaking in 1989. However, the 90s witnessed a decline, with the average price dropping to $228,372 in 1999.
- 2000-2022: The turn of the millennium marked a significant shift. From 2000 onwards, there was a consistent rise in the average price of homes. By 2022, the average price had skyrocketed to a staggering $1,189,758.
Here’s a snapshot of the average prices over selected years:
- 1977: $64,559
- 1987: $189,105
- 1997: $211,307
- 2007: $376,236
- 2017: $822,510
- 2022: $1,189,758
A Graphical Journey: The data also presents an intriguing graphical representation showcasing the annual average TRREB MLS System Sale Price.
It’s fascinating to see the price trends from 1975, starting from nearly $0K and reaching up to $1.2M by 2025.
Navigating Toronto’s Real Estate Evolution: A Reflective Insight
With its bustling streets and iconic skyline, Toronto has always held a special place in my heart. As a long-time resident and keen observer of the city’s real estate landscape, I’ve witnessed its remarkable transformation. Let’s journey to understand the nuances of Toronto’s real estate evolution, blending data with personal observations.
Historical Data Meets Personal Observations
1977-1999: The late 70s and 80s were intriguing. Data shows a steady rise in home prices, peaking in 1989. The 90s, however, presented challenges, with prices taking a dip. Reflecting on conversations from that era, there was a palpable sense of caution among potential homeowners.
2000-2022: The new millennium ushered in optimism. Data indicates a consistent rise in home prices, and personal interactions mirrored this sentiment. By 2022, Toronto’s average home price reached a staggering $1,189,758, a testament to the city’s resilience and growth.
Factors Influencing the Market
Economic Drivers
The early 2000s, marked by low-interest rates, made borrowing appealing and invigorated the housing market. Additionally, Toronto’s emergence as a hub for foreign investors significantly influenced property prices.
Sociological Shifts
Toronto’s allure lies in its diversity. The city’s demographic shifts have continually reshaped its housing demands from young professionals to vibrant immigrant communities.
Government and Global Events
Policies, both local and global events, have left their mark. These factors have interwoven with personal investment decisions, from foreign buyer taxes to global financial shifts, shaping the market’s trajectory.
Concluding Thoughts
Toronto’s real estate market is more than just numbers; it reflects its people, their aspirations, and the city’s global appeal. As we look ahead, understanding this blend of data and personal experiences provides a holistic view and is essential for investors and residents alike.